7. Sitzung
Response Times
Neurowissenschaft Computerlab FS 22
2022-04-05
What are Response Times?
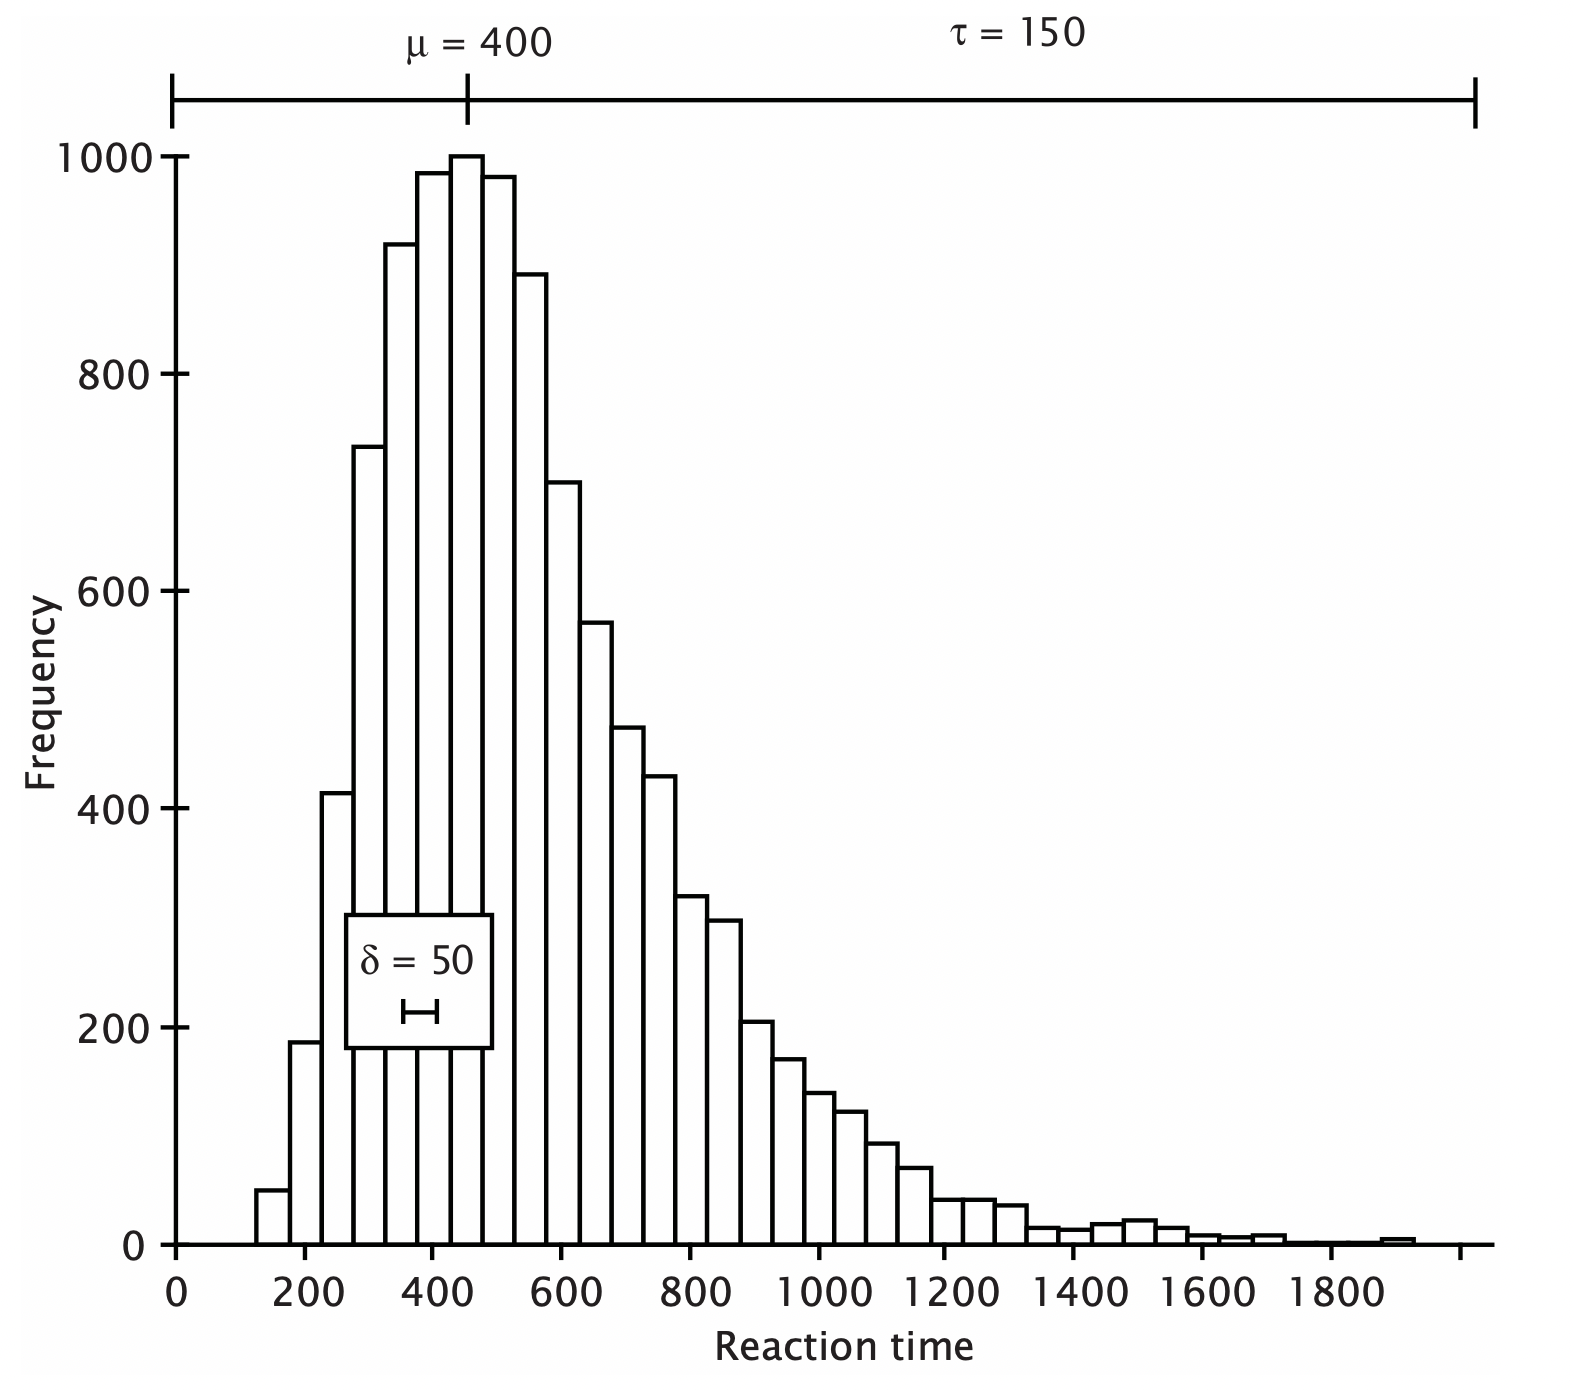
Typical distribution of response times.
Time taken to complete a task.
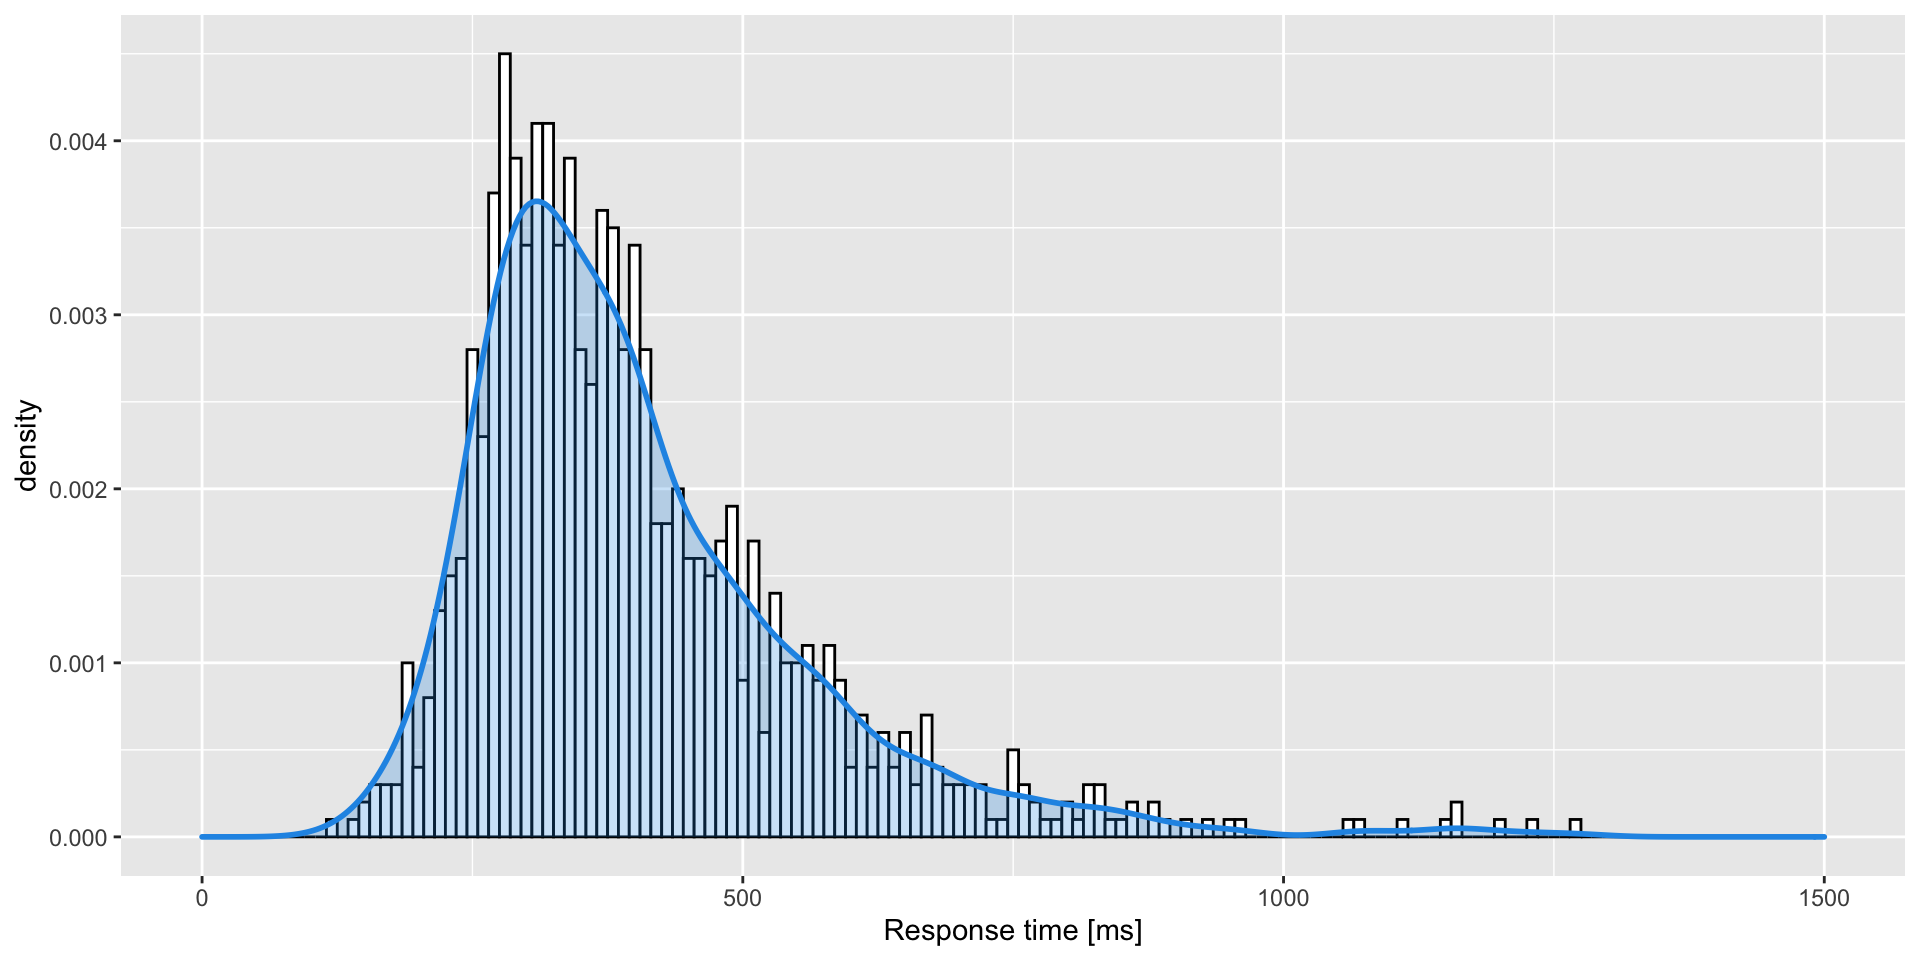
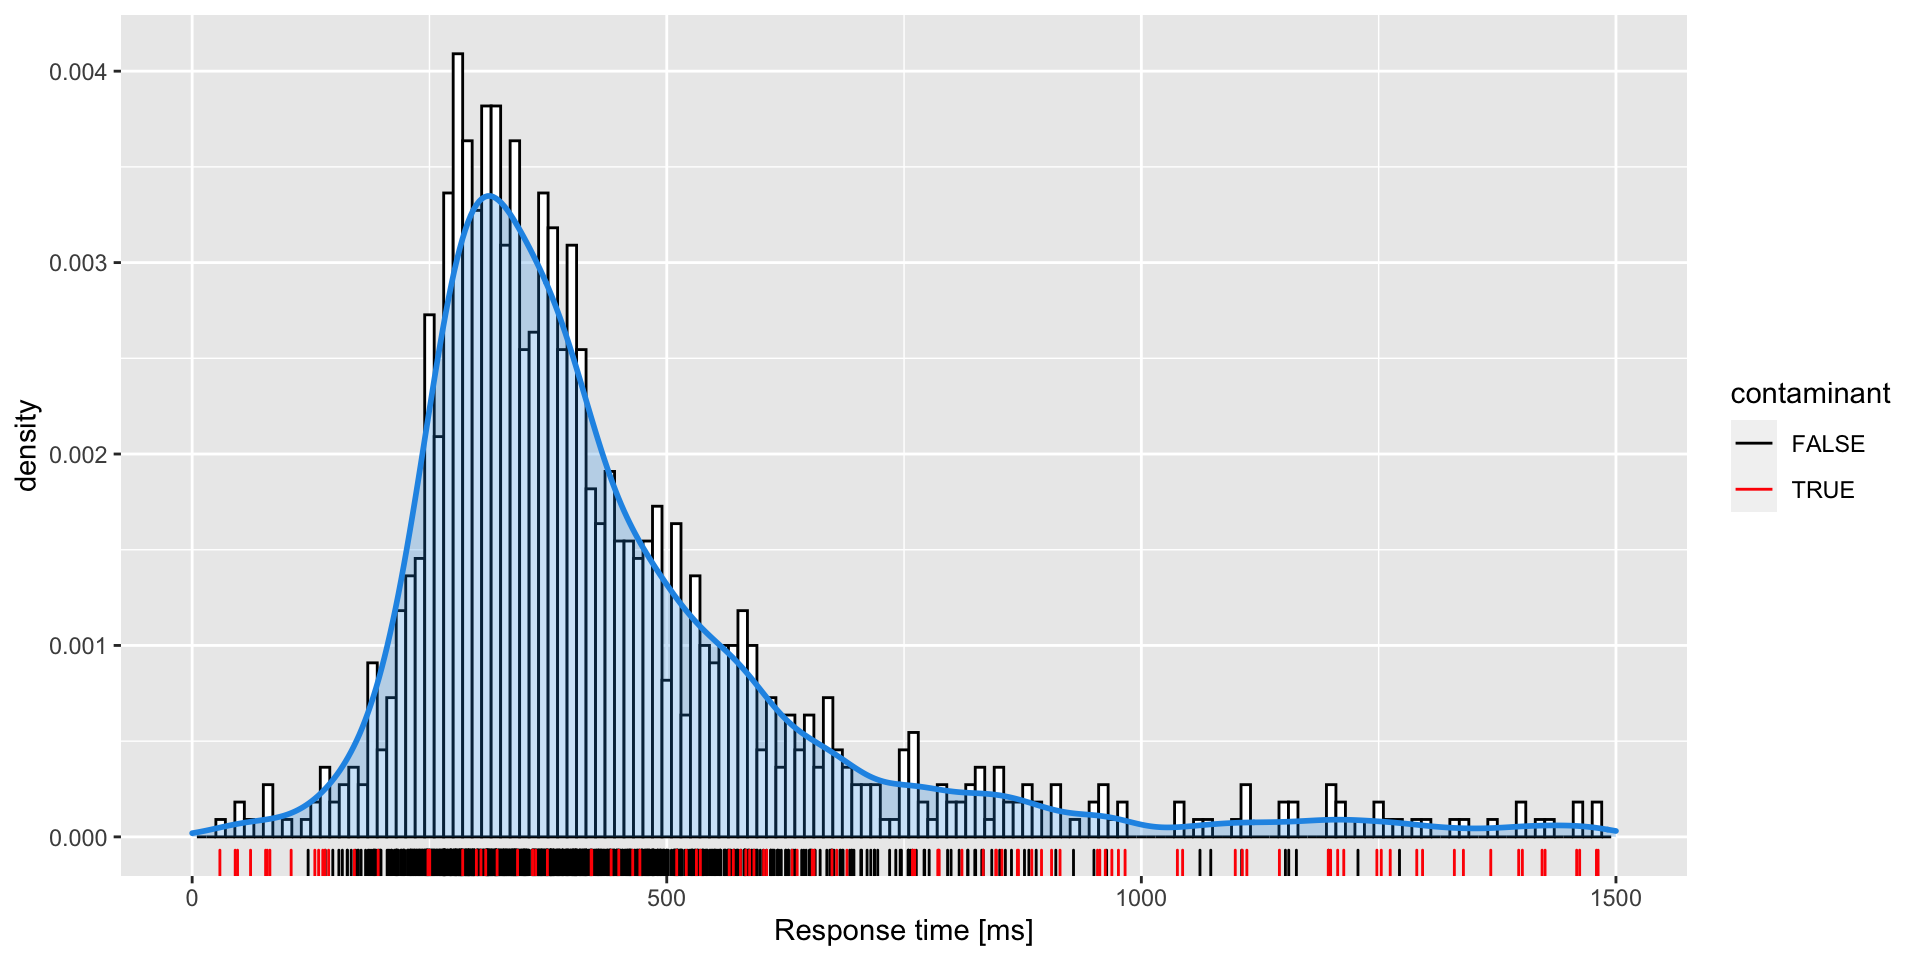
Typically, some observed RTs are not a result of the process of interest,but contaminants. Luce (1986) demonstrated that genuine RTs have a minimum value of \(> 100\) ms: the time needed for physiological processes (stimulus perception, motor responses).
Whelan, R. (2008). Effective Analysis of Reaction Time Data. The Psychological Record, 58(3), 475–482. https://doi.org/10.1007/BF03395630
Tadpoles
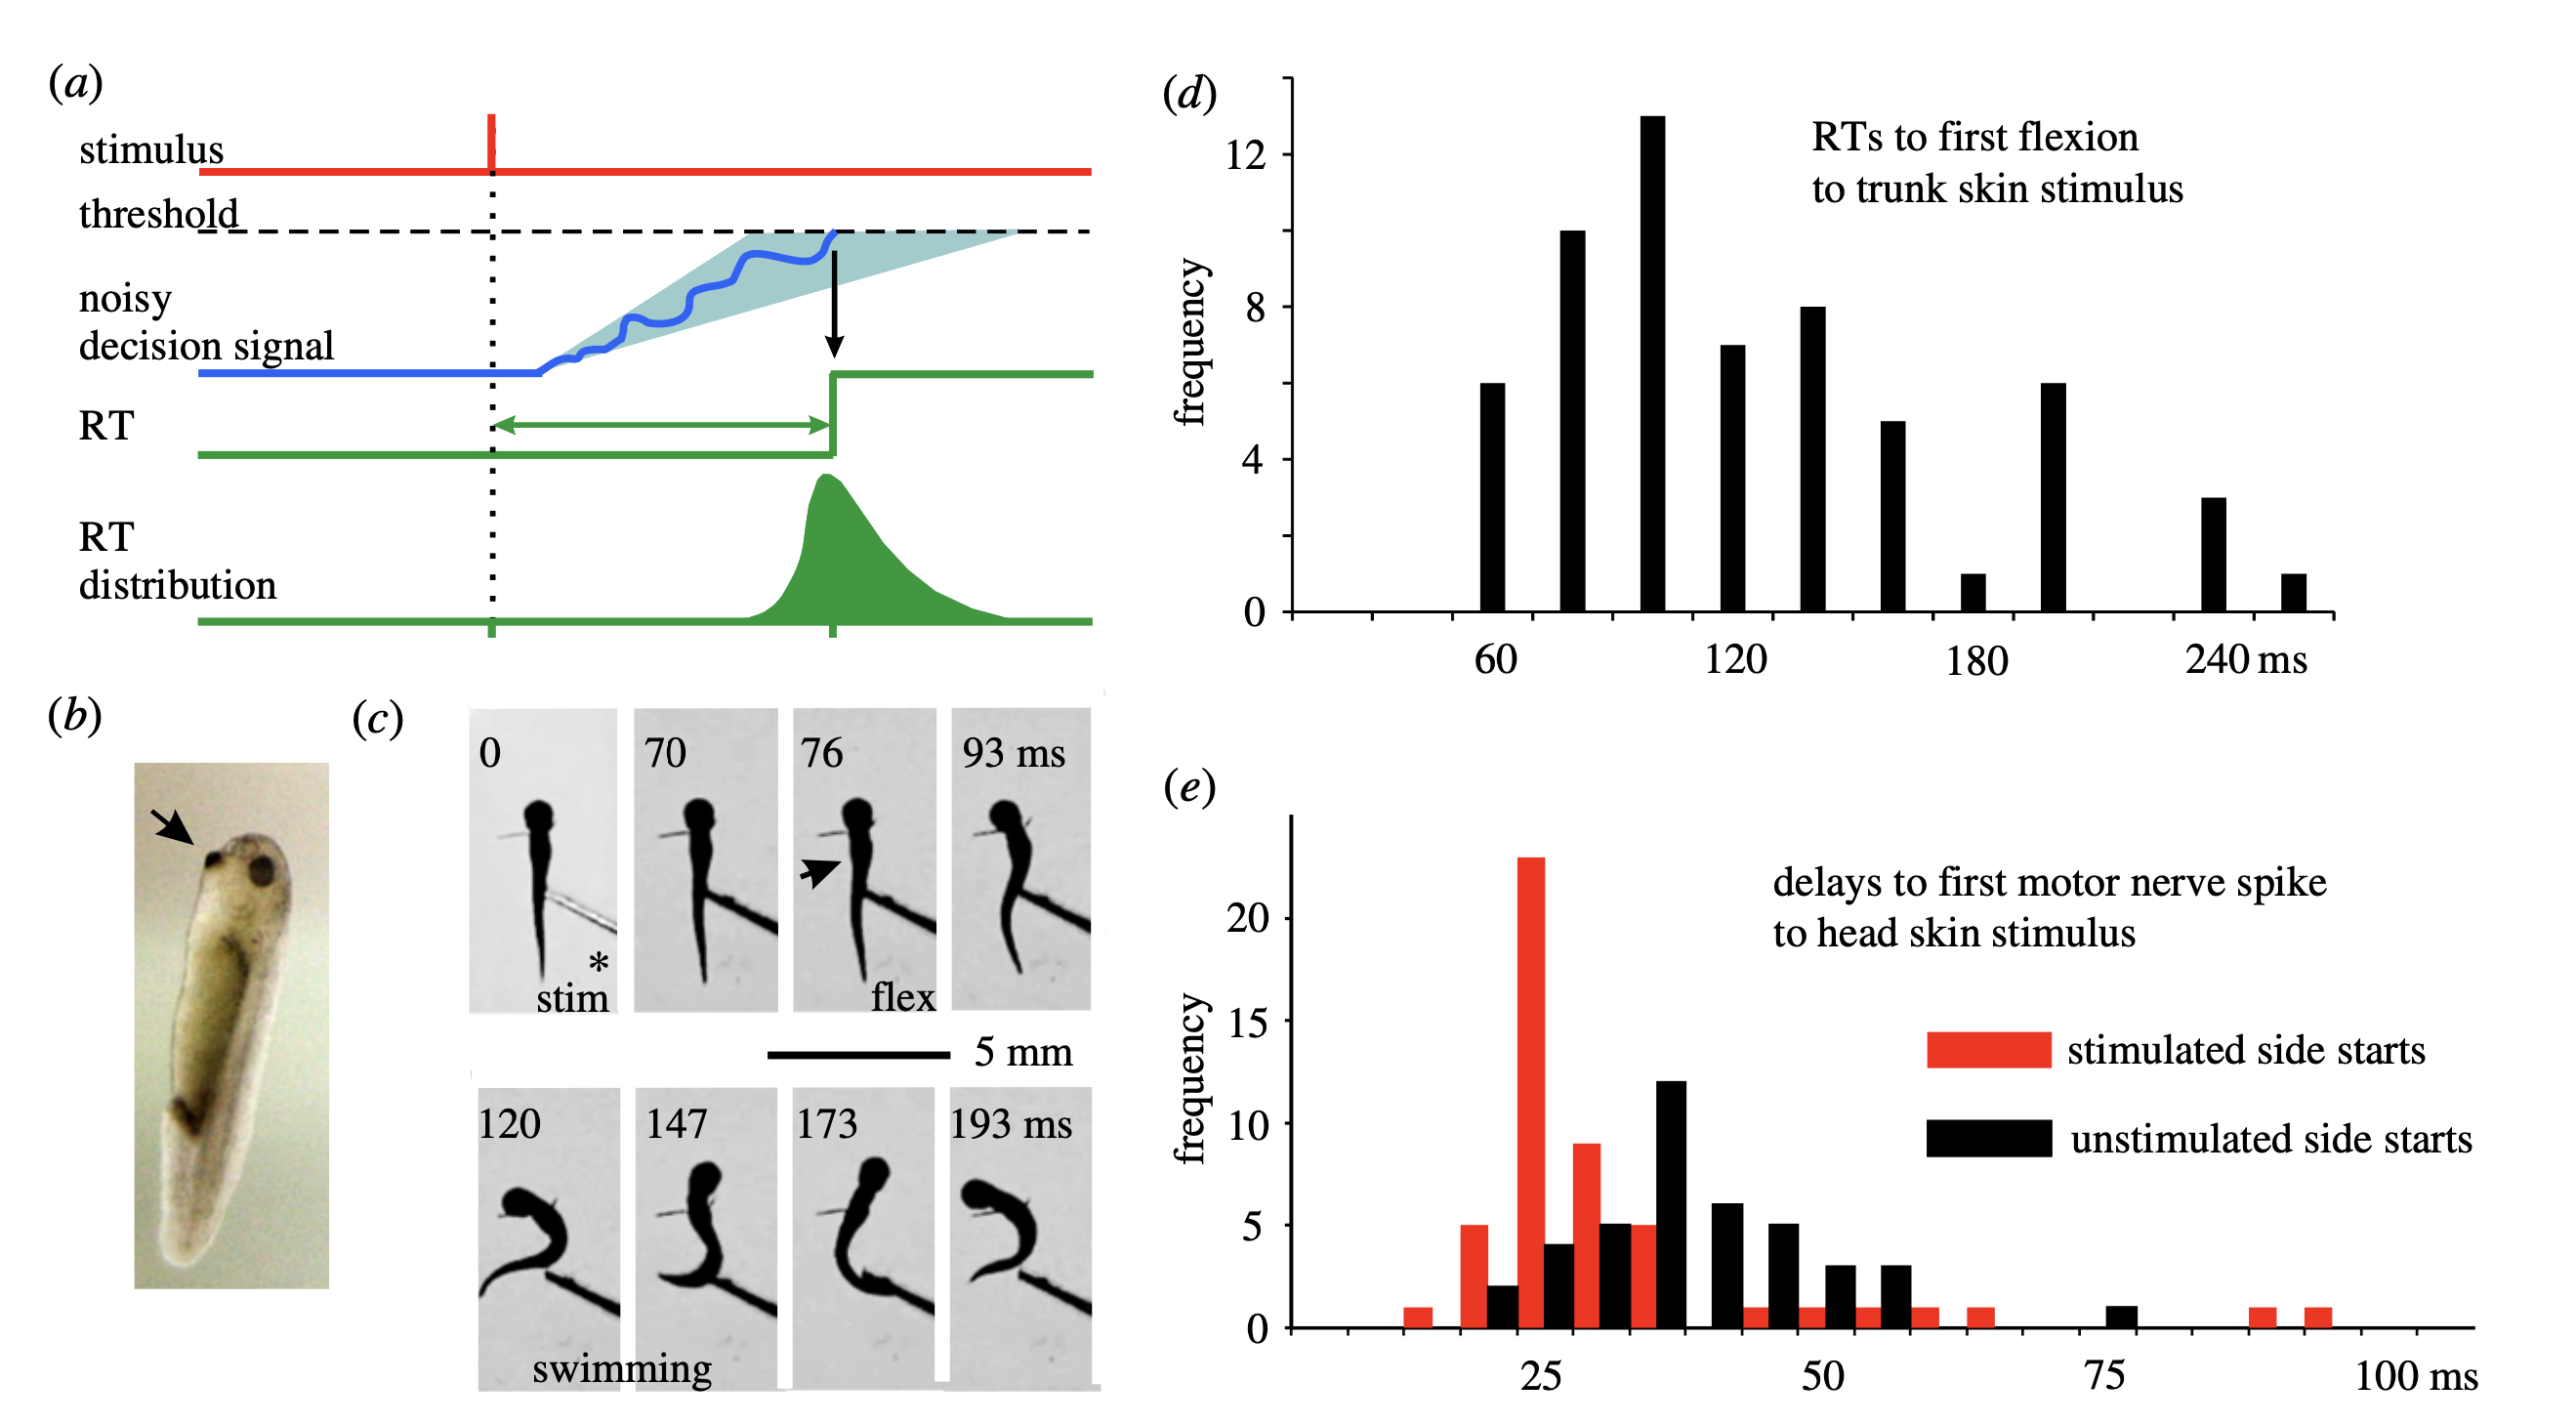
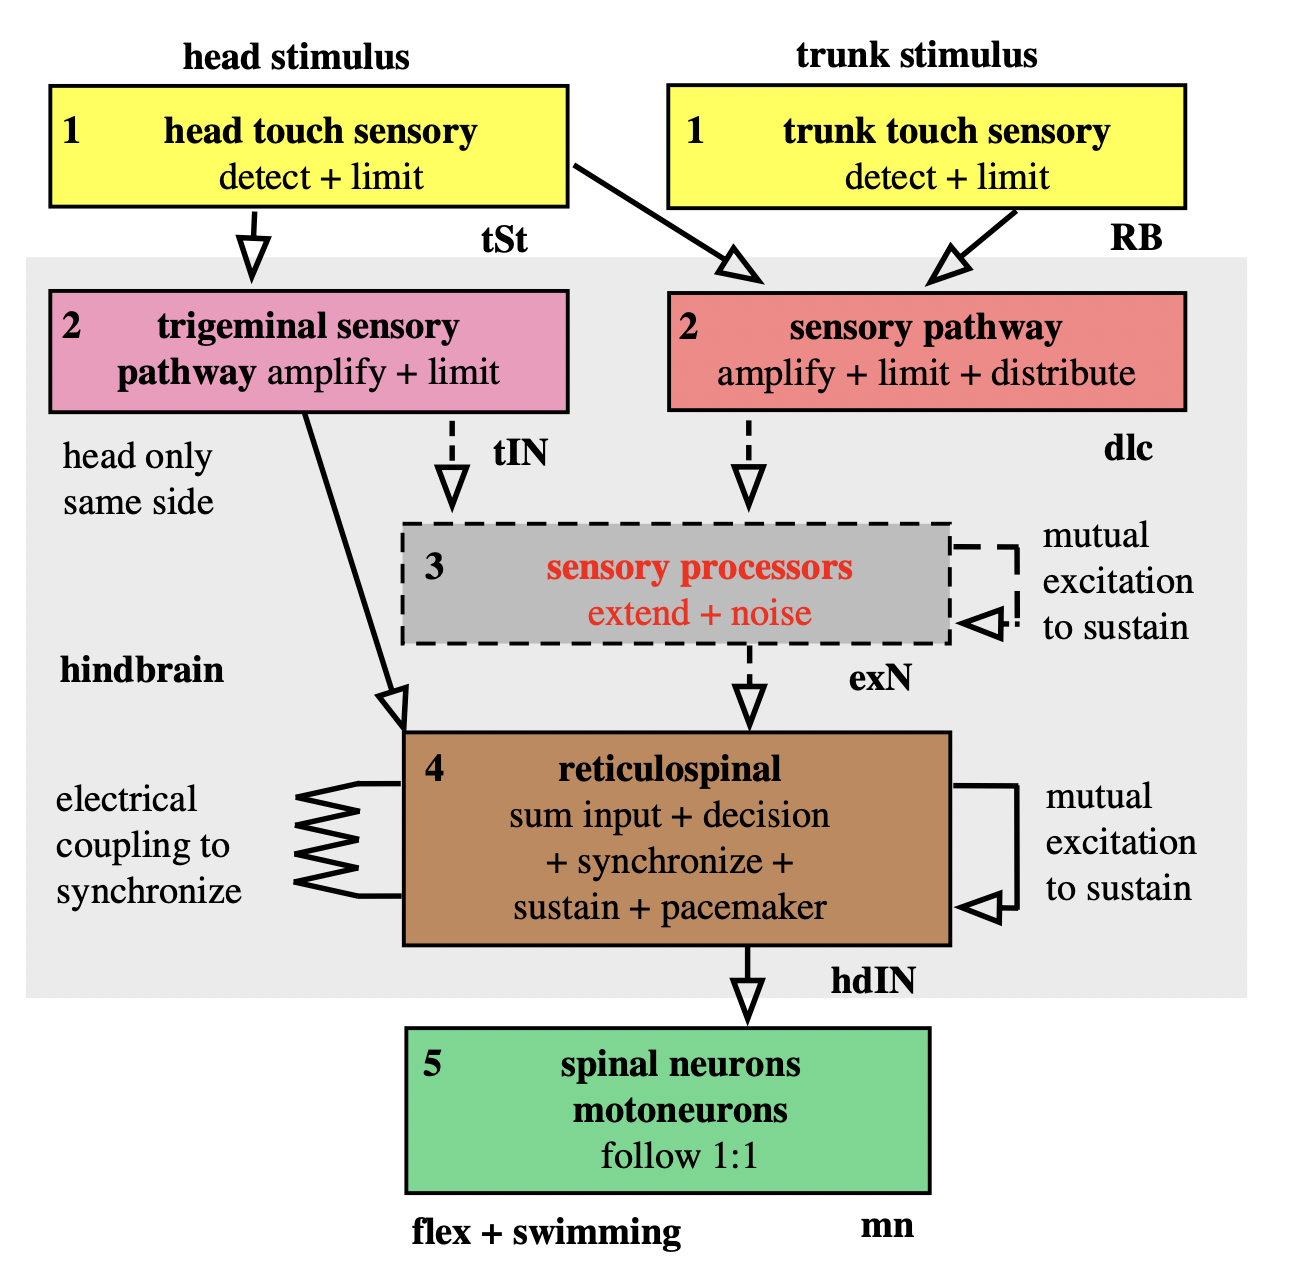
Roberts, A., Borisyuk, R., Buhl, E., Ferrario, A., Koutsikou, S., Li, W.-C., & Soffe, S. R. (2019). The decision to move: Response times, neuronal circuits and sensory memory in a simple vertebrate. Proceedings of the Royal Society B: Biological Sciences, 286(1899), 20190297. https://doi.org/10.1098/rspb.2019.0297
ADHD
Performance variability is the essence of ADHD.
Children with ADHD demonstrate greater RT variability than nonclinical controls on speeded RT tasks.
Response variability is related to a distributed brain network including frontal lobes (implicated in the pathophysiology of ADHD).
- Traditional RT measures (sample mean and standard deviation) showed that children with ADHD were slower and more variable in responding than controls.
- Children with ADHD had a greater number of RTs beyond their mean performance than the control group. Were not generally slower but were prone to attentional lapses.
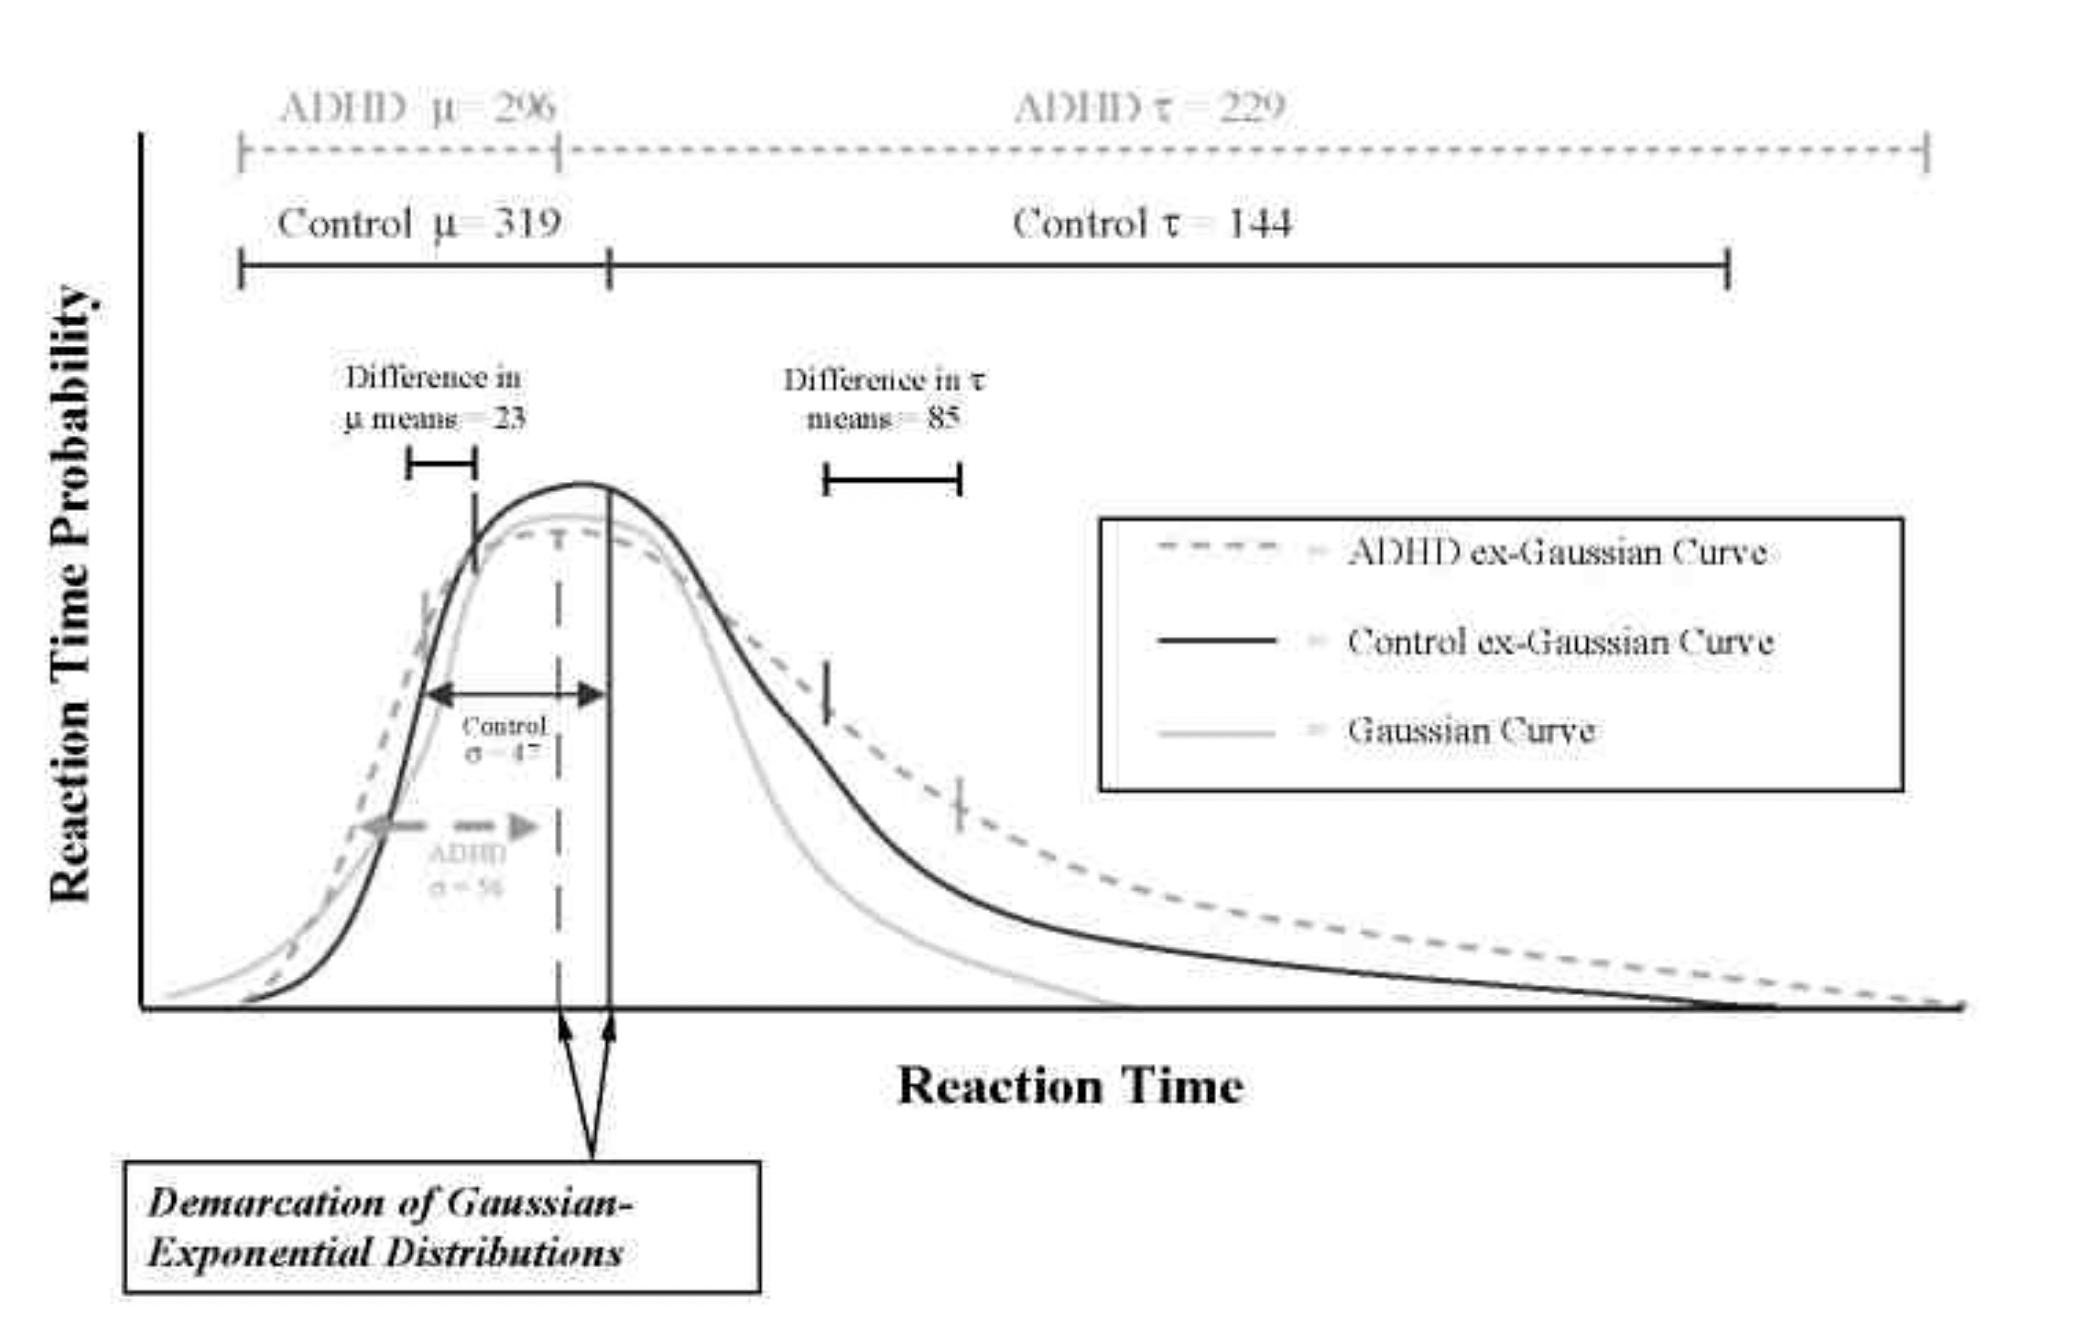
Hervey, A. S., Epstein, J. N., Curry, J. F., Tonev, S., Eugene Arnold, L., Keith Conners, C., Hinshaw, S. P., Swanson, J. M., & Hechtman, L. (2006). Reaction Time Distribution Analysis of Neuropsychological Performance in an ADHD Sample. Child Neuropsychology, 12(2), 125–140. https://doi.org/10.1080/09297040500499081
Beyond mean differences
- Most analyses of RT data are conducted by using the statistical techniques with which psychologists are most familiar, such as analysis of variance (ANOVA) on the sample mean. Unfortunately, these methods are usually inappropriate for RT data, because they have little power to detect genuine differences in RT between conditions.
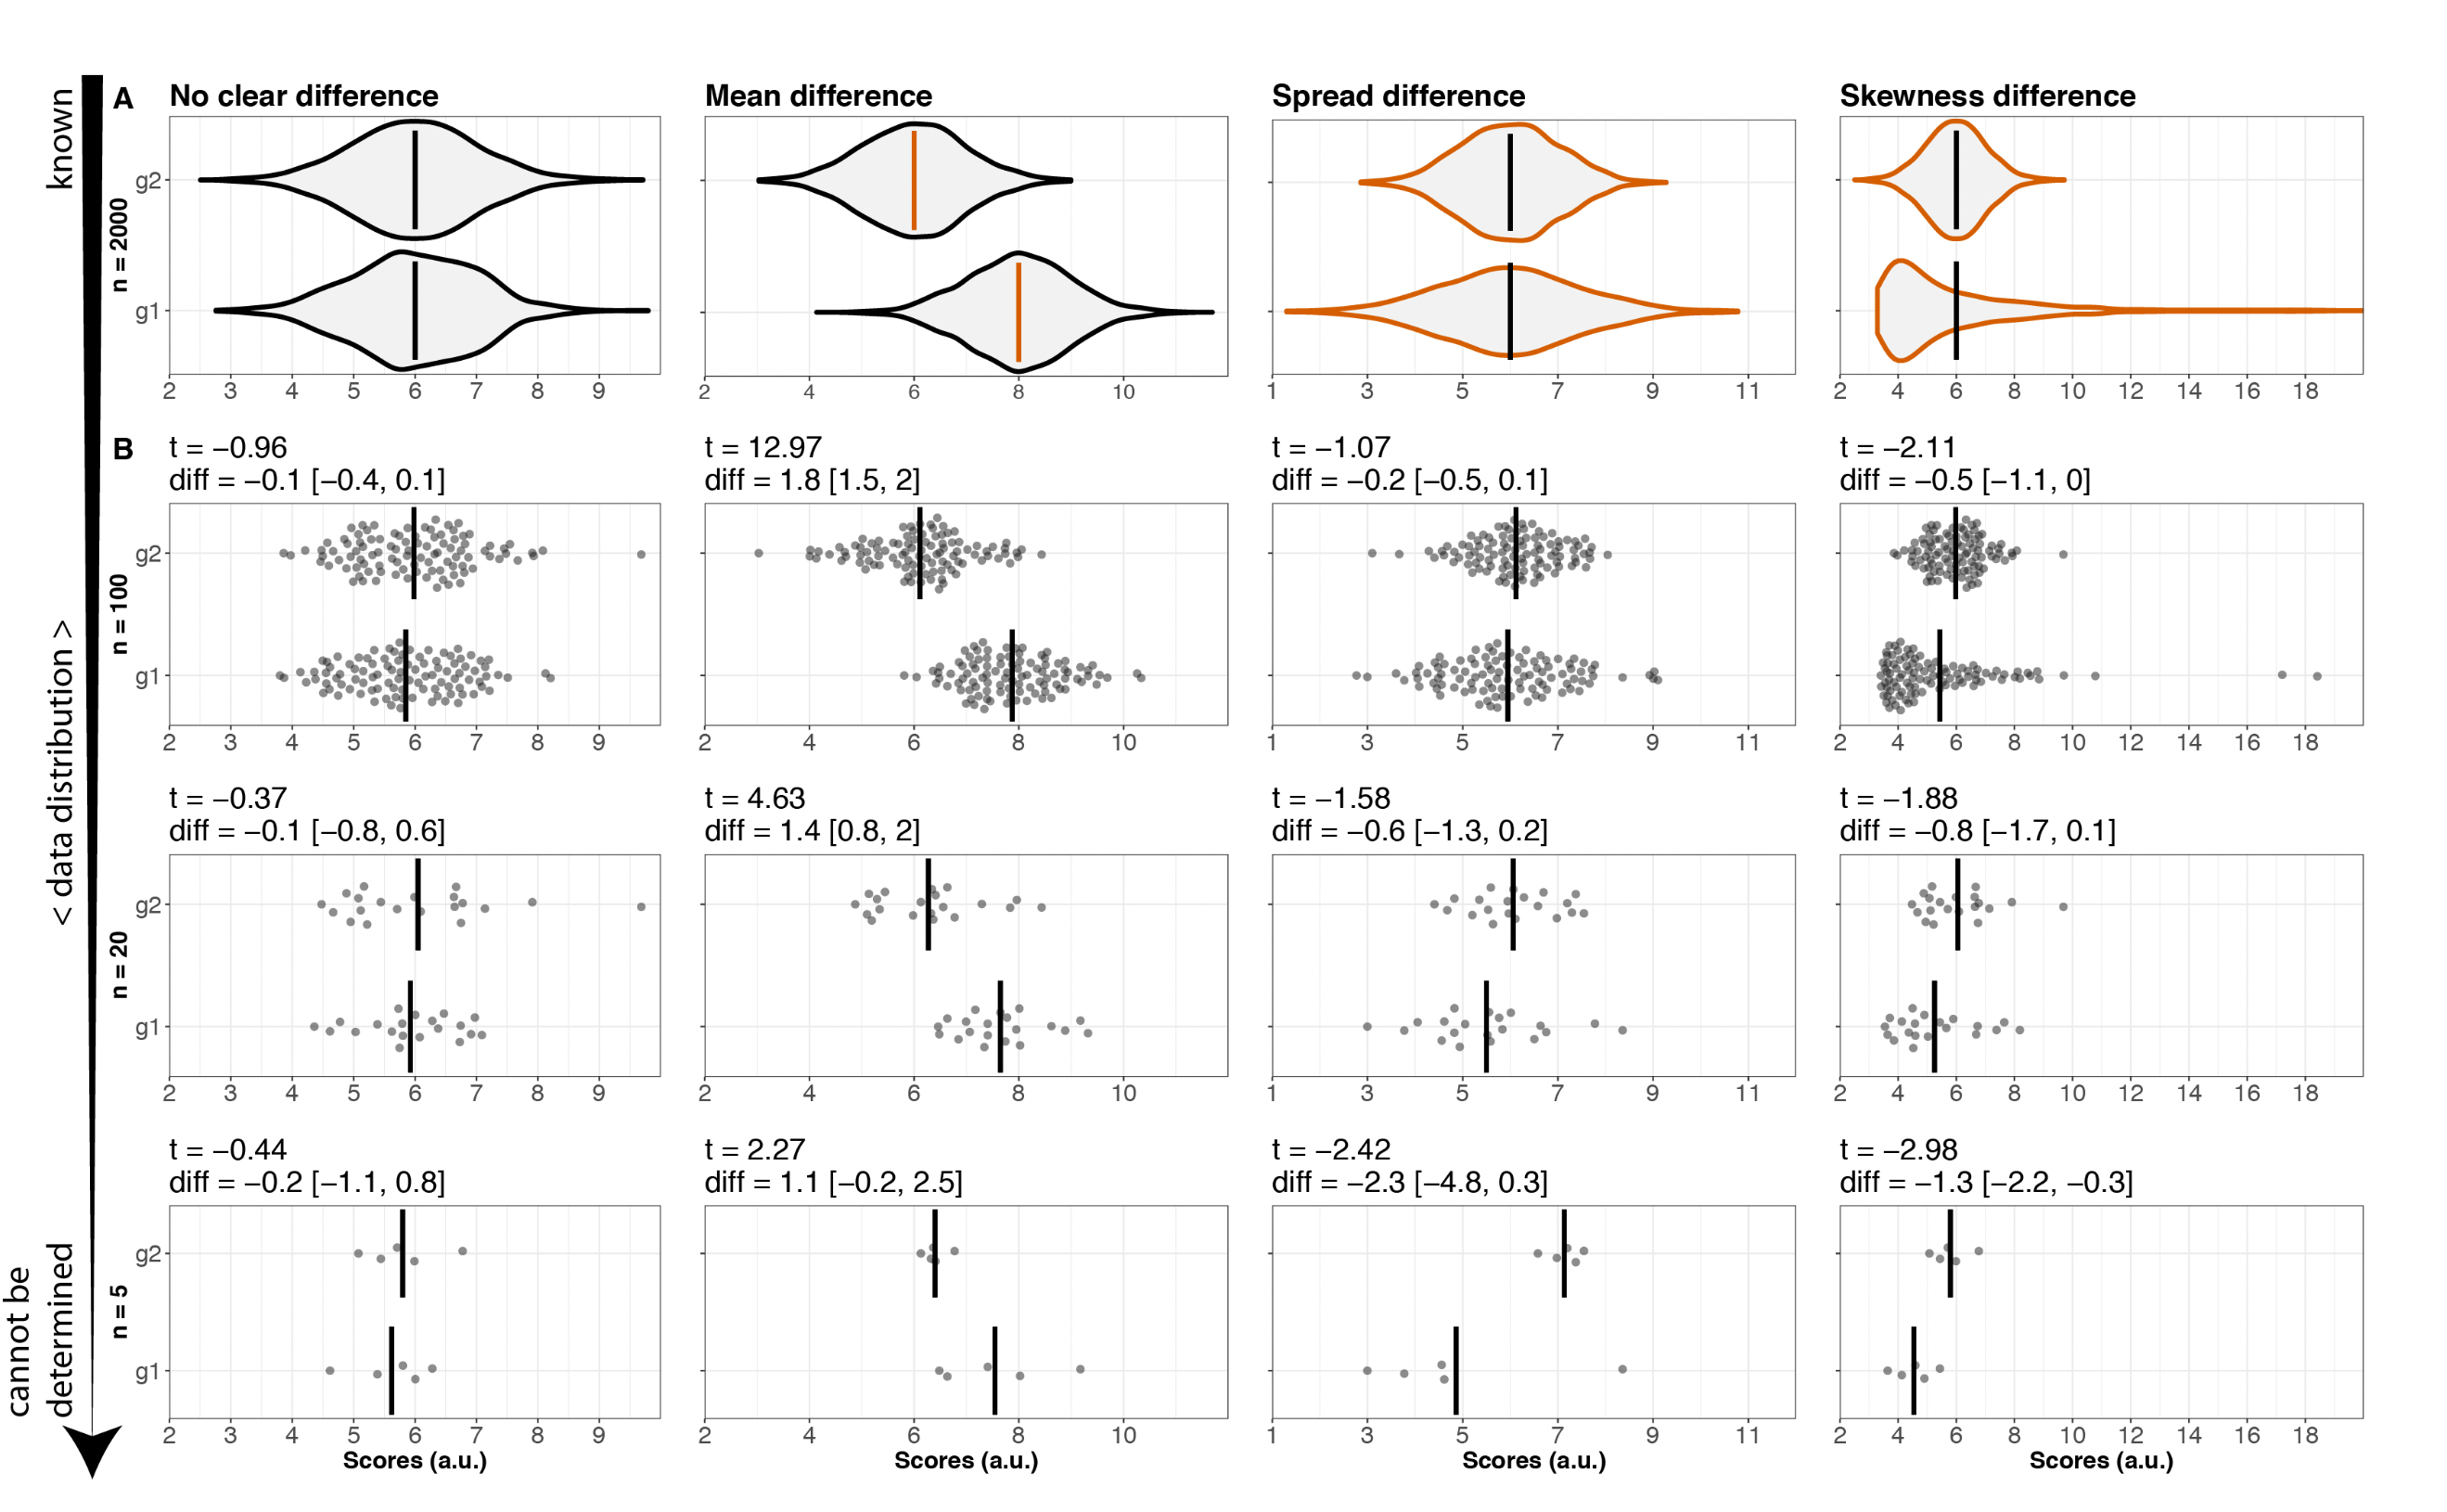
Rousselet, G. A., Pernet, C. R., & Wilcox, R. R. (2017). Beyond differences in means: Robust graphical methods to compare two groups in neuroscience. European Journal of Neuroscience, 46(2), 1738–1748. [https://doi.org/10.1111/ejn.13610](https://doi.org/10.1111/
Beyond mean differences
Deciles
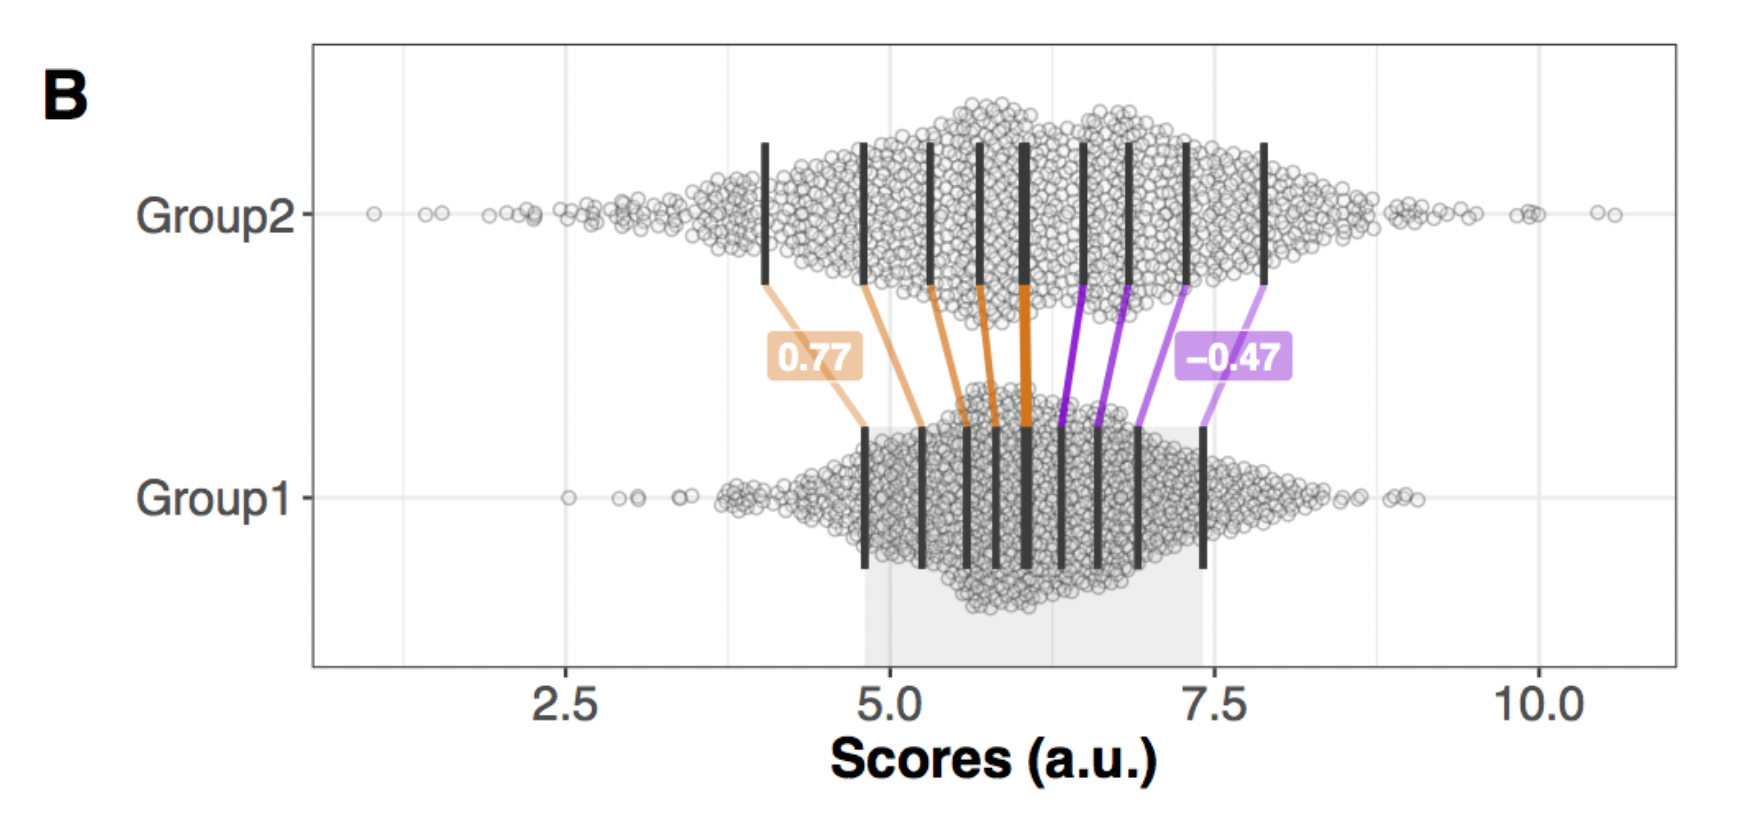
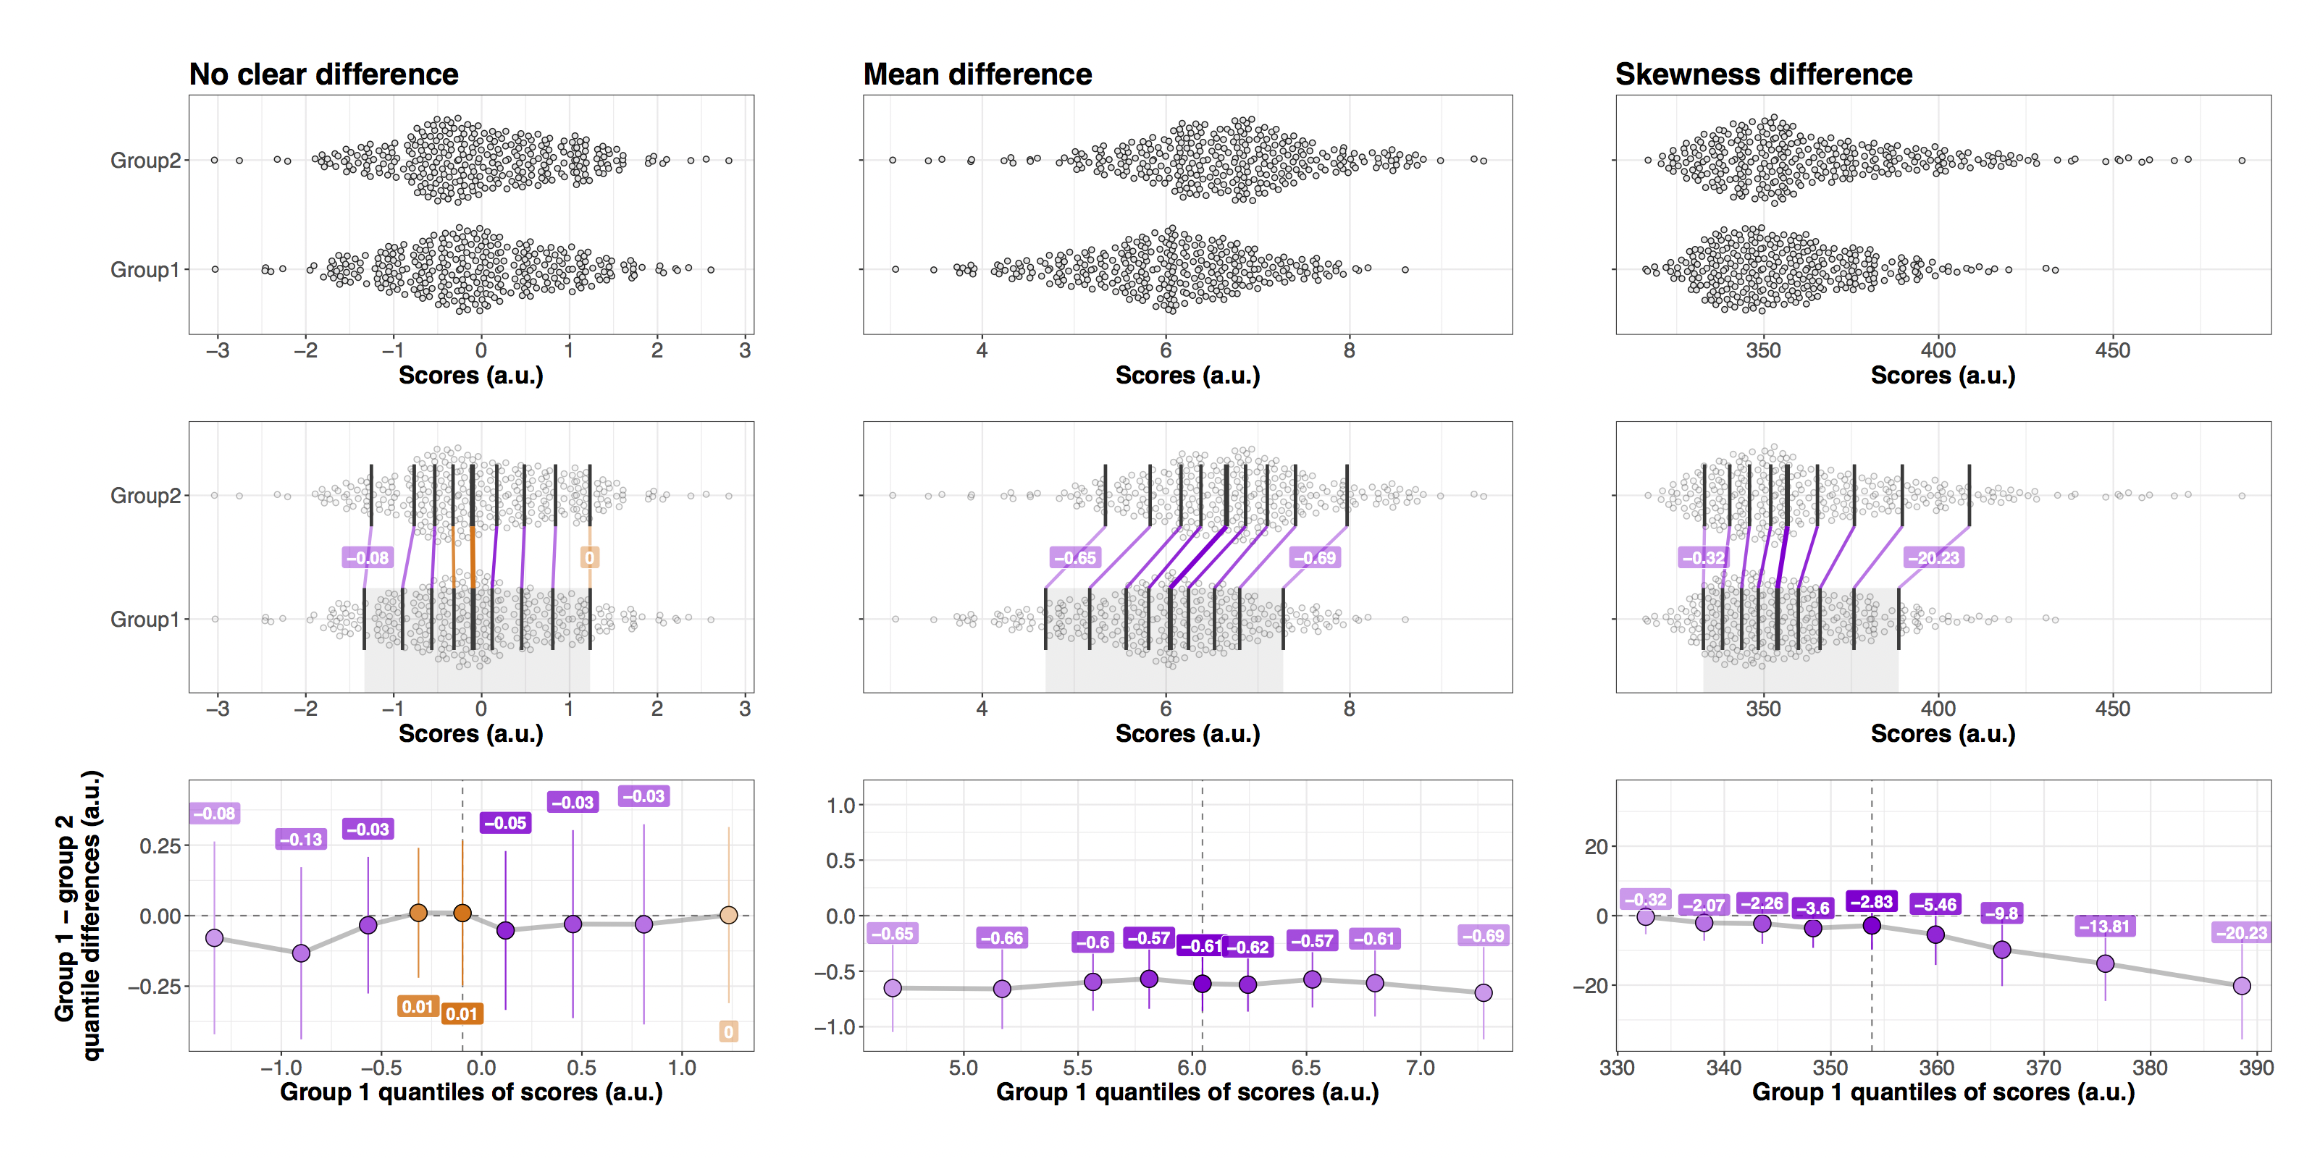
Shift function
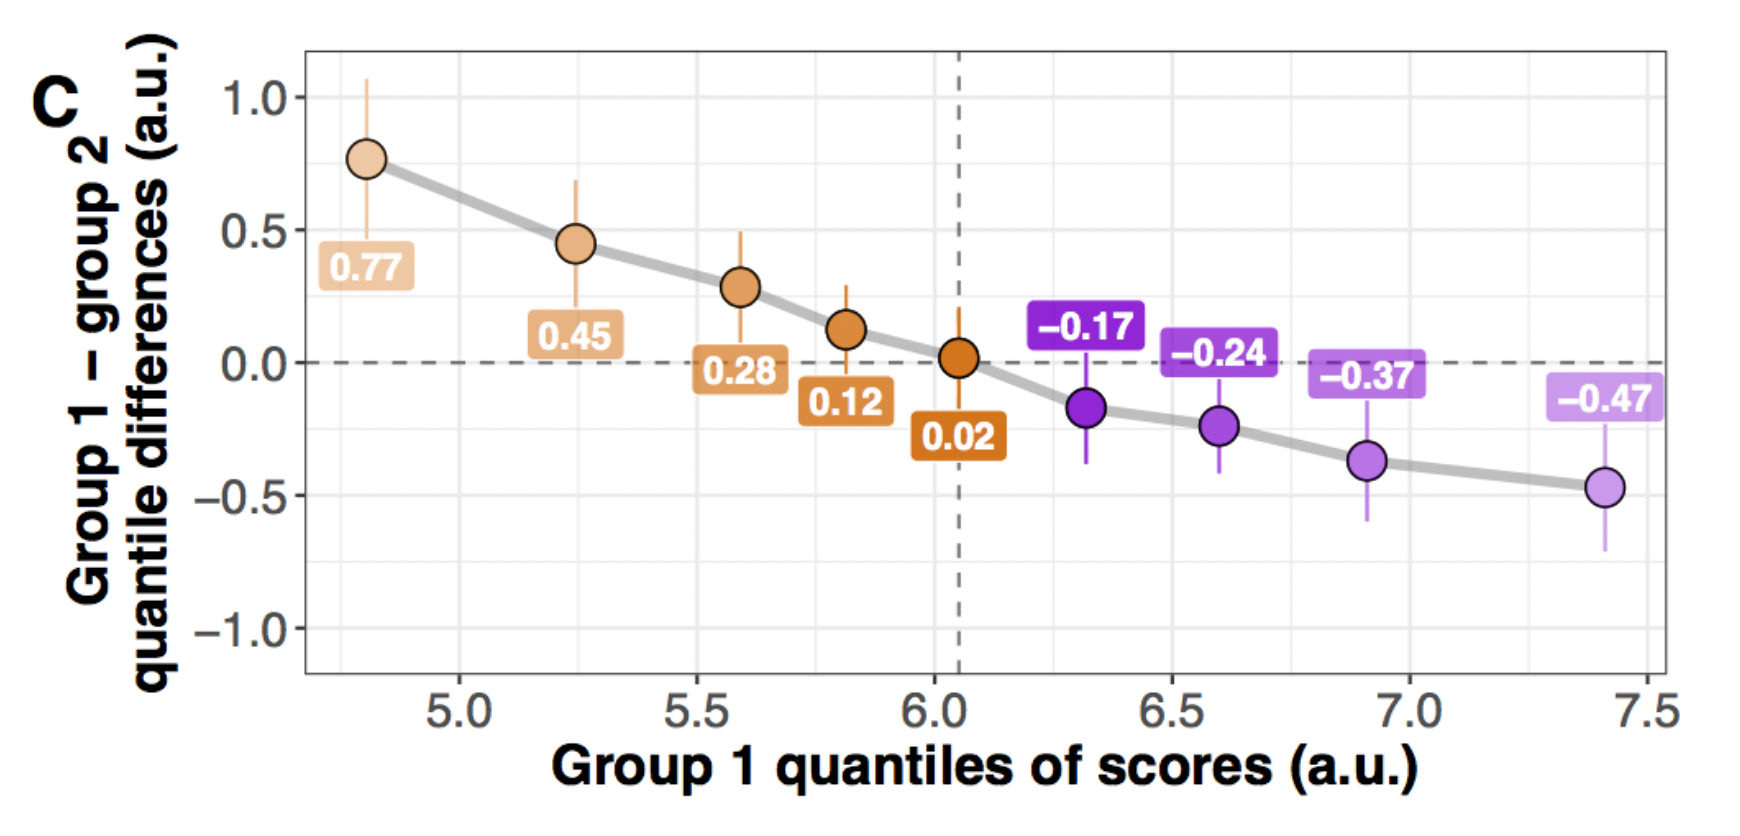
For each decile, the shift function illustrates by how much one distribution needs to be shifted to match another one.
In our example, we illustrate by how much we need to shift deciles from group 2 to match deciles from group 1.
Beyond mean differences
![]()