library(tidyverse)
tibble(x = seq(-3, 3, by = 0.1)) %>%
  ggplot(aes(x)) +
  stat_function(fun = pnorm, colour = "steelblue3",
                  args = list(mean = 0, sd = 1),
                  size = 1.5) +
  labs(y = "Probability", x = "Z Score") +
  scale_y_continuous(limits = c(0, 1)) +
  scale_x_continuous(limits = c(-3.5, 3.5), breaks = -3:3) +
  ggtitle("Cumulative distribution function / pnorm()") +
theme_linedraw()5. Sitzung
Signal Detection Theory
Neurowissenschaft Computerlab FS 22
2022-03-22
Signal detection theory
The key assumptions of SDT
Separate representation and decision-making.
Signal and noise trials can be represented as values along a uni-dimensional “strength” construct.
Both types trials produce Gaussian random variables that represent strength.
Both variances are assumed to be the same.
The decision-making assumption of is that yes and no responses are produced by comparing the strength of the current trial to a fixed criterion. If the strength exceeds the criterion a “yes” response is made, otherwise a “no” response is made. ]
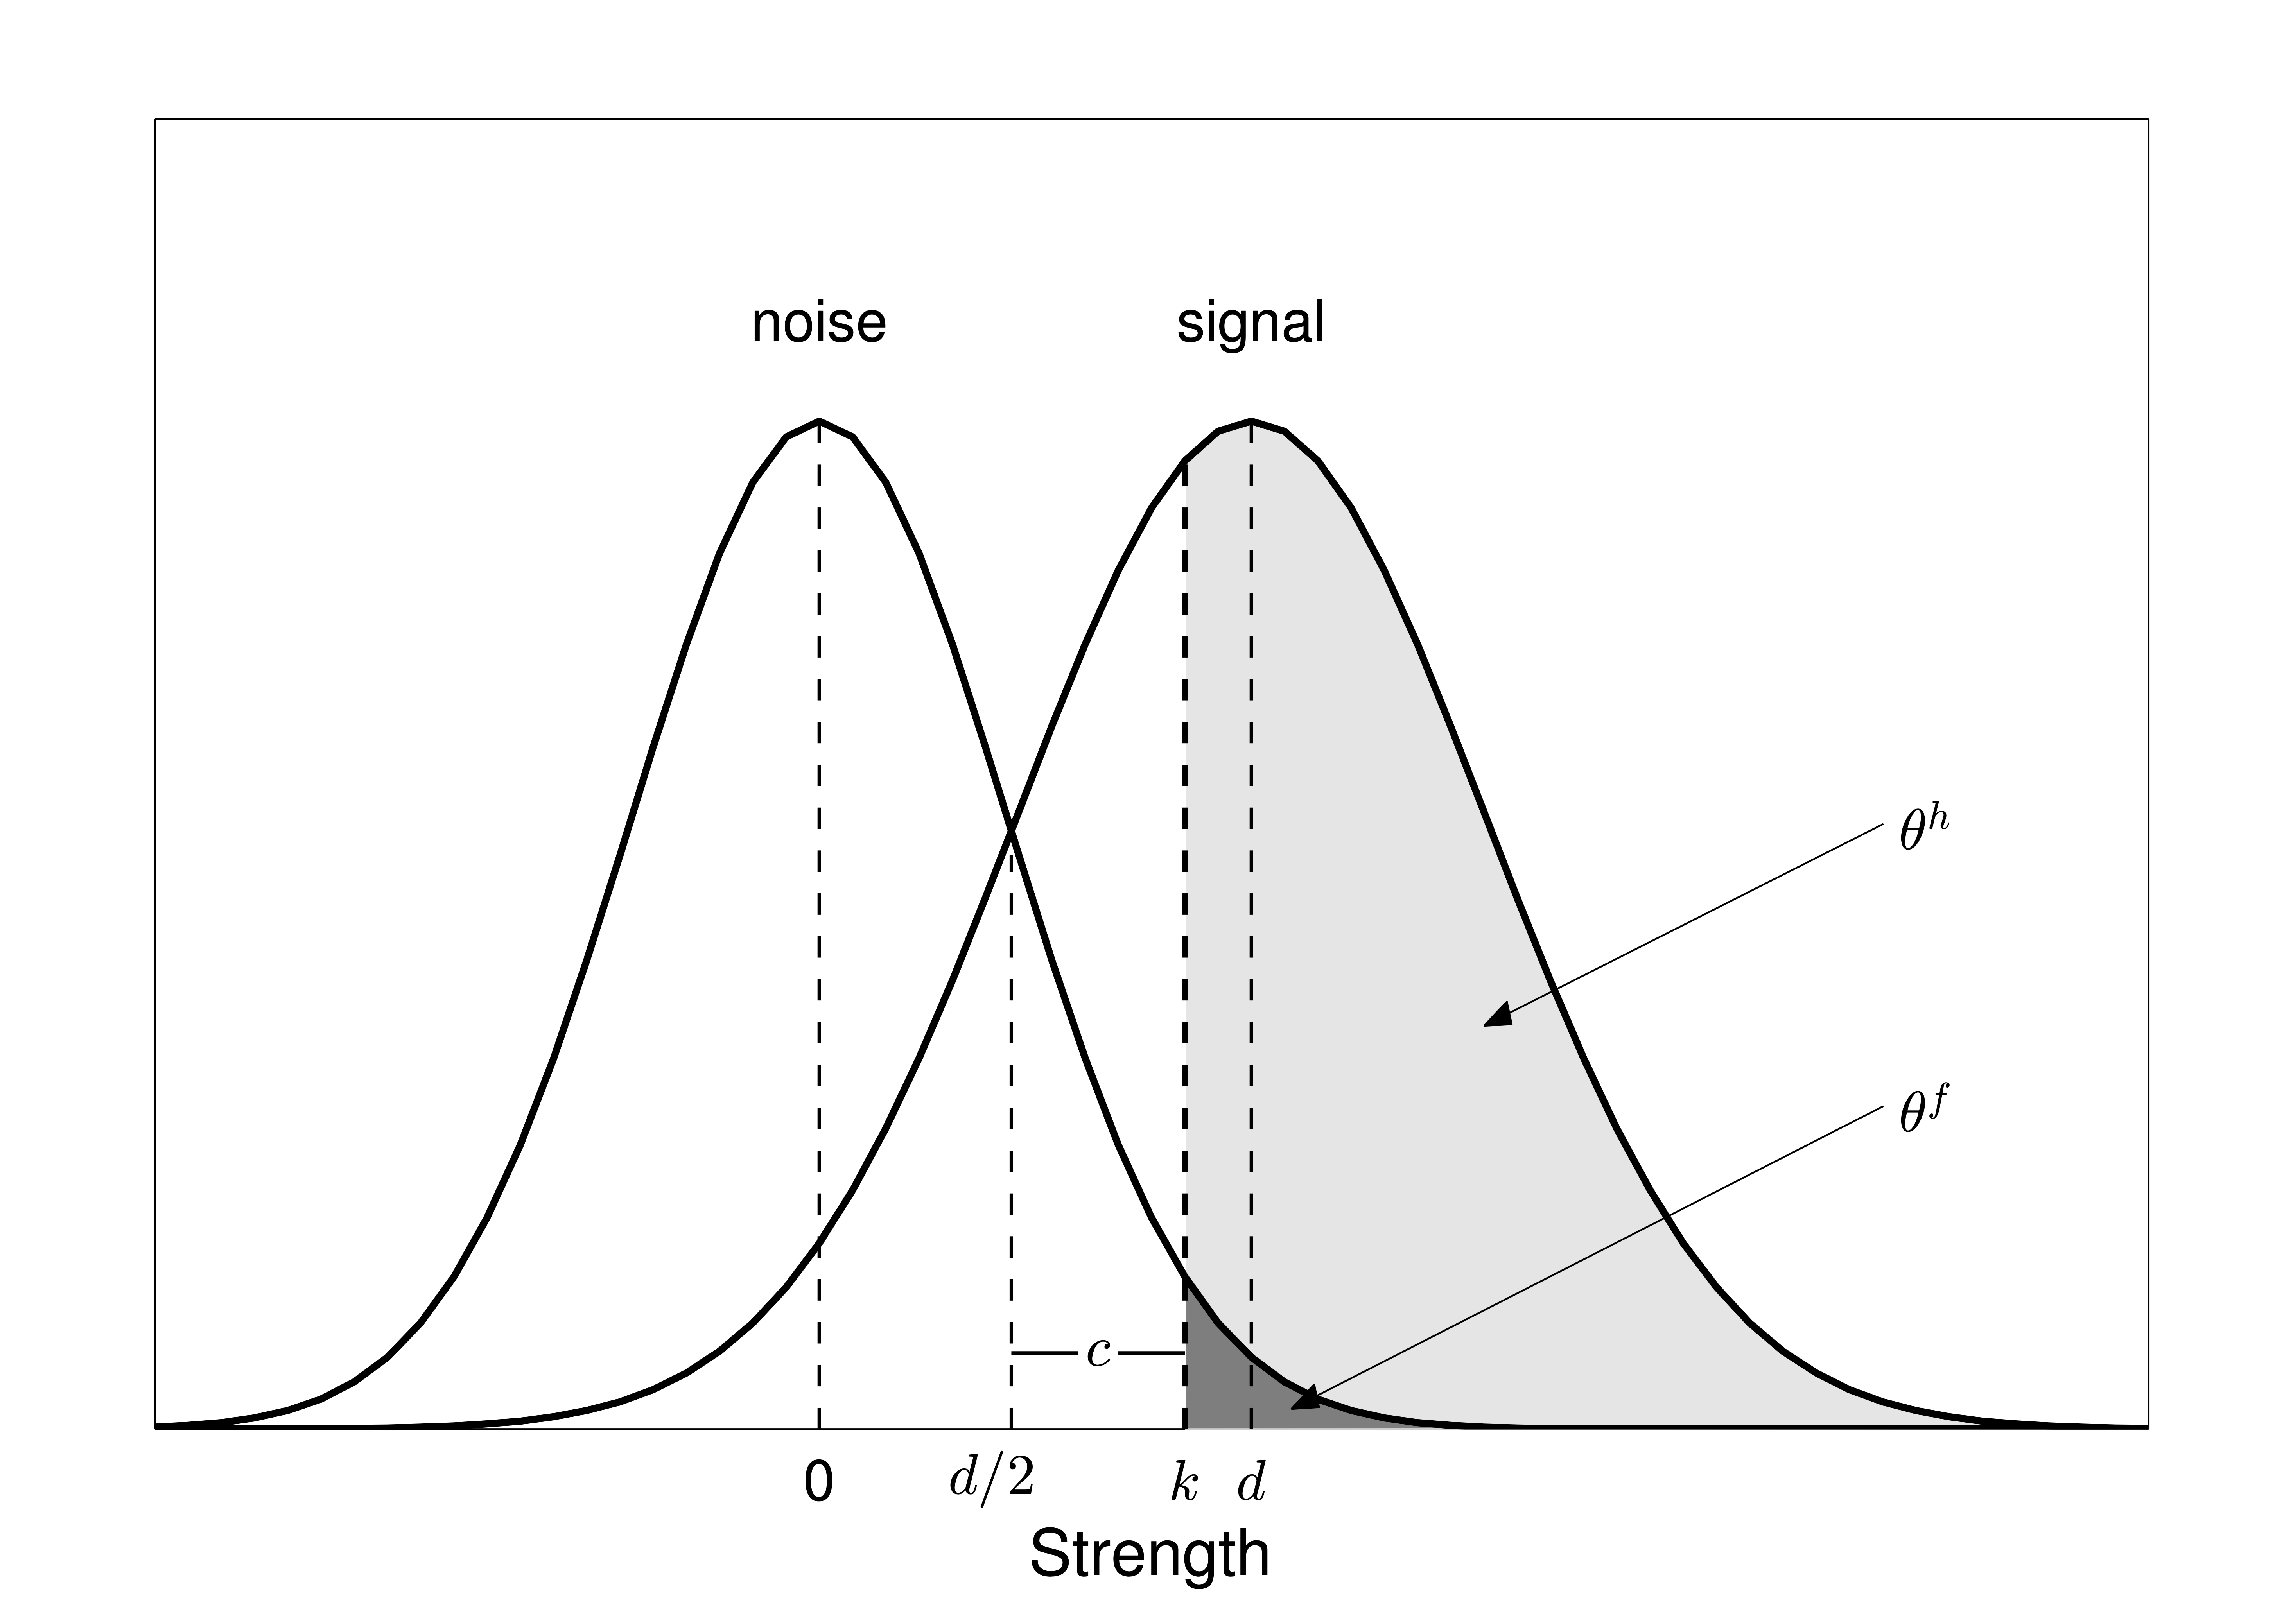
c and d'
The mean of the signal distribution is
d'. This makesd'a measure of the discriminability of the signal trials from the noise trials – it corresponds to the distance between the two distributions.The strength value
d/2is special, because it is the criterion value that maximizes the probability of a correct classification when signal and noise trials are equally likely to occur.ca measure of bias, because it corresponds to how different the actual criterion is from the unbiased one. Positive values of c correspond to a bias towards saying no, and so to an increase in correct rejections at the expense of an increase in misses. Negative values of c correspond to a bias towards saying yes, and so to an increase in hits at the expense of an increase in false alarms.
Computing SDT Measures in R
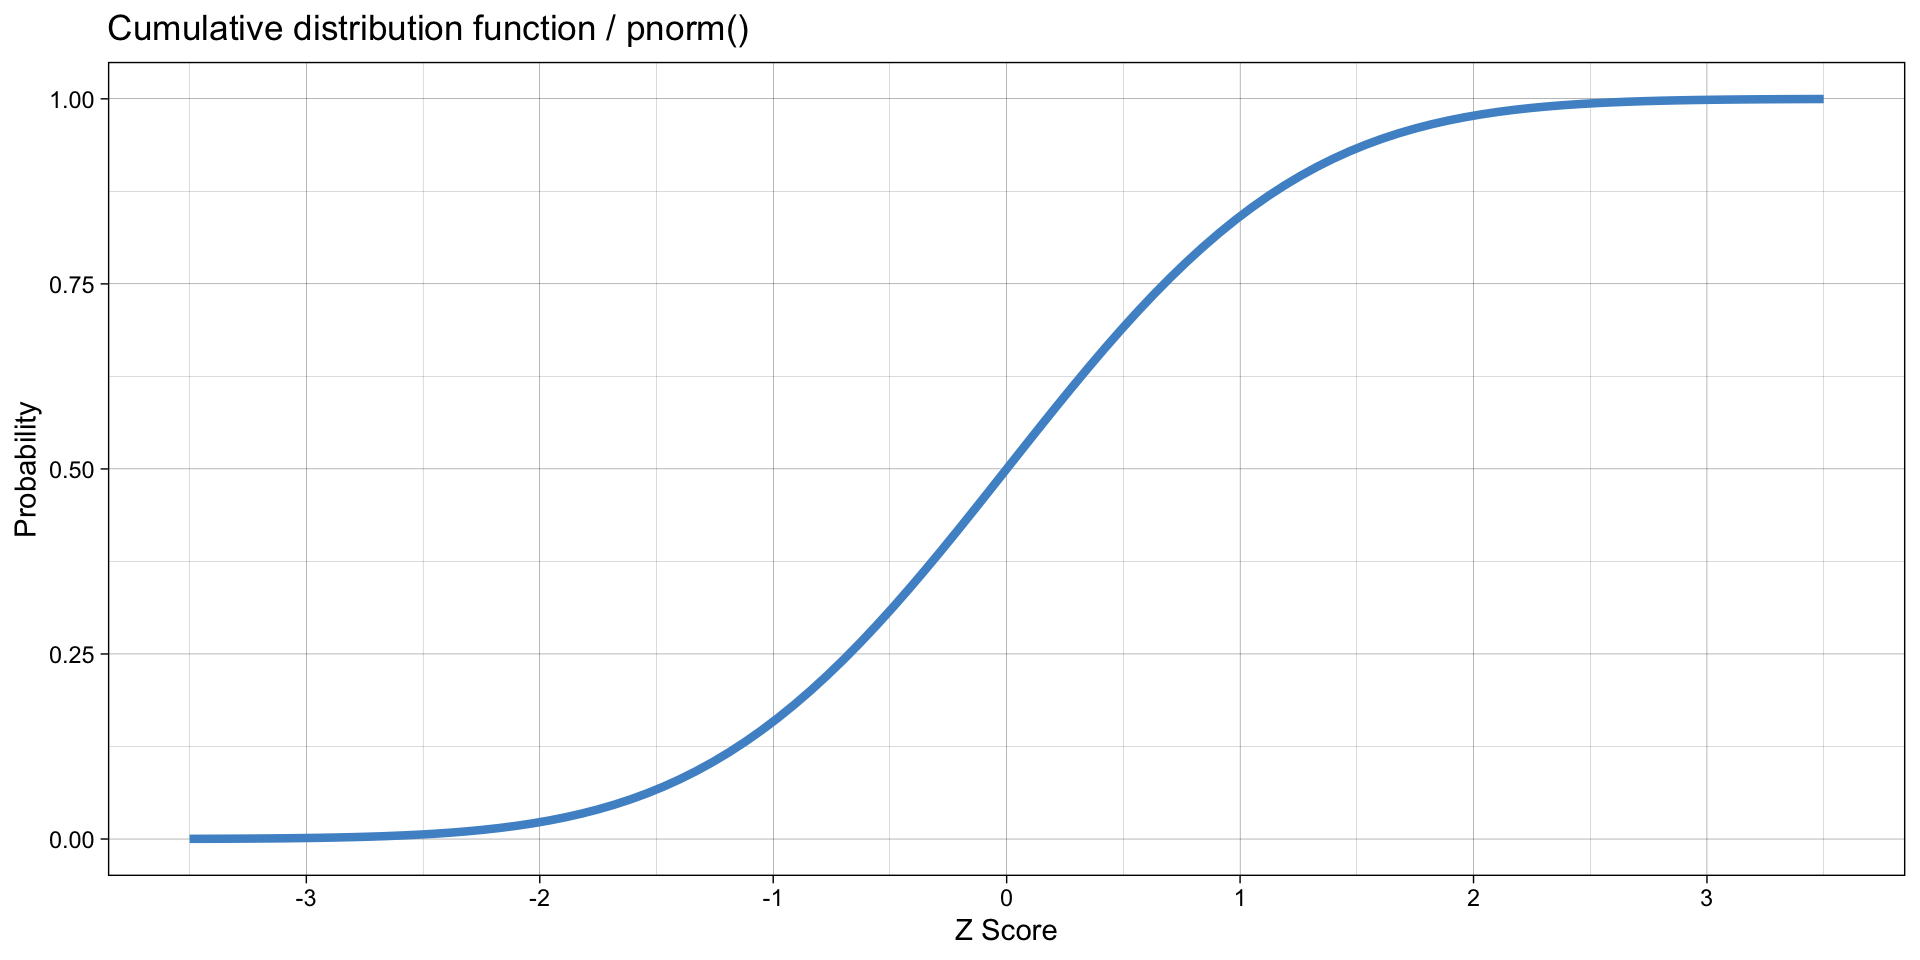
Cumulative distribution function: pnorm()
tibble(x = seq(0, 1, by = 0.01)) %>%
  ggplot(aes(x)) +
  stat_function(fun = qnorm, colour = "steelblue3",
                  args = list(mean = 0, sd = 1),
                  size = 1.5) +
  labs(x = "Probability", y = "Z Score") +
  scale_x_continuous(limits = c(0, 1)) +
  scale_y_continuous(limits = c(-3.5, 3.5), breaks = -3:3) +
  ggtitle("Probit function / quantile function / inverse cdf / qnorm()") +
  theme_linedraw()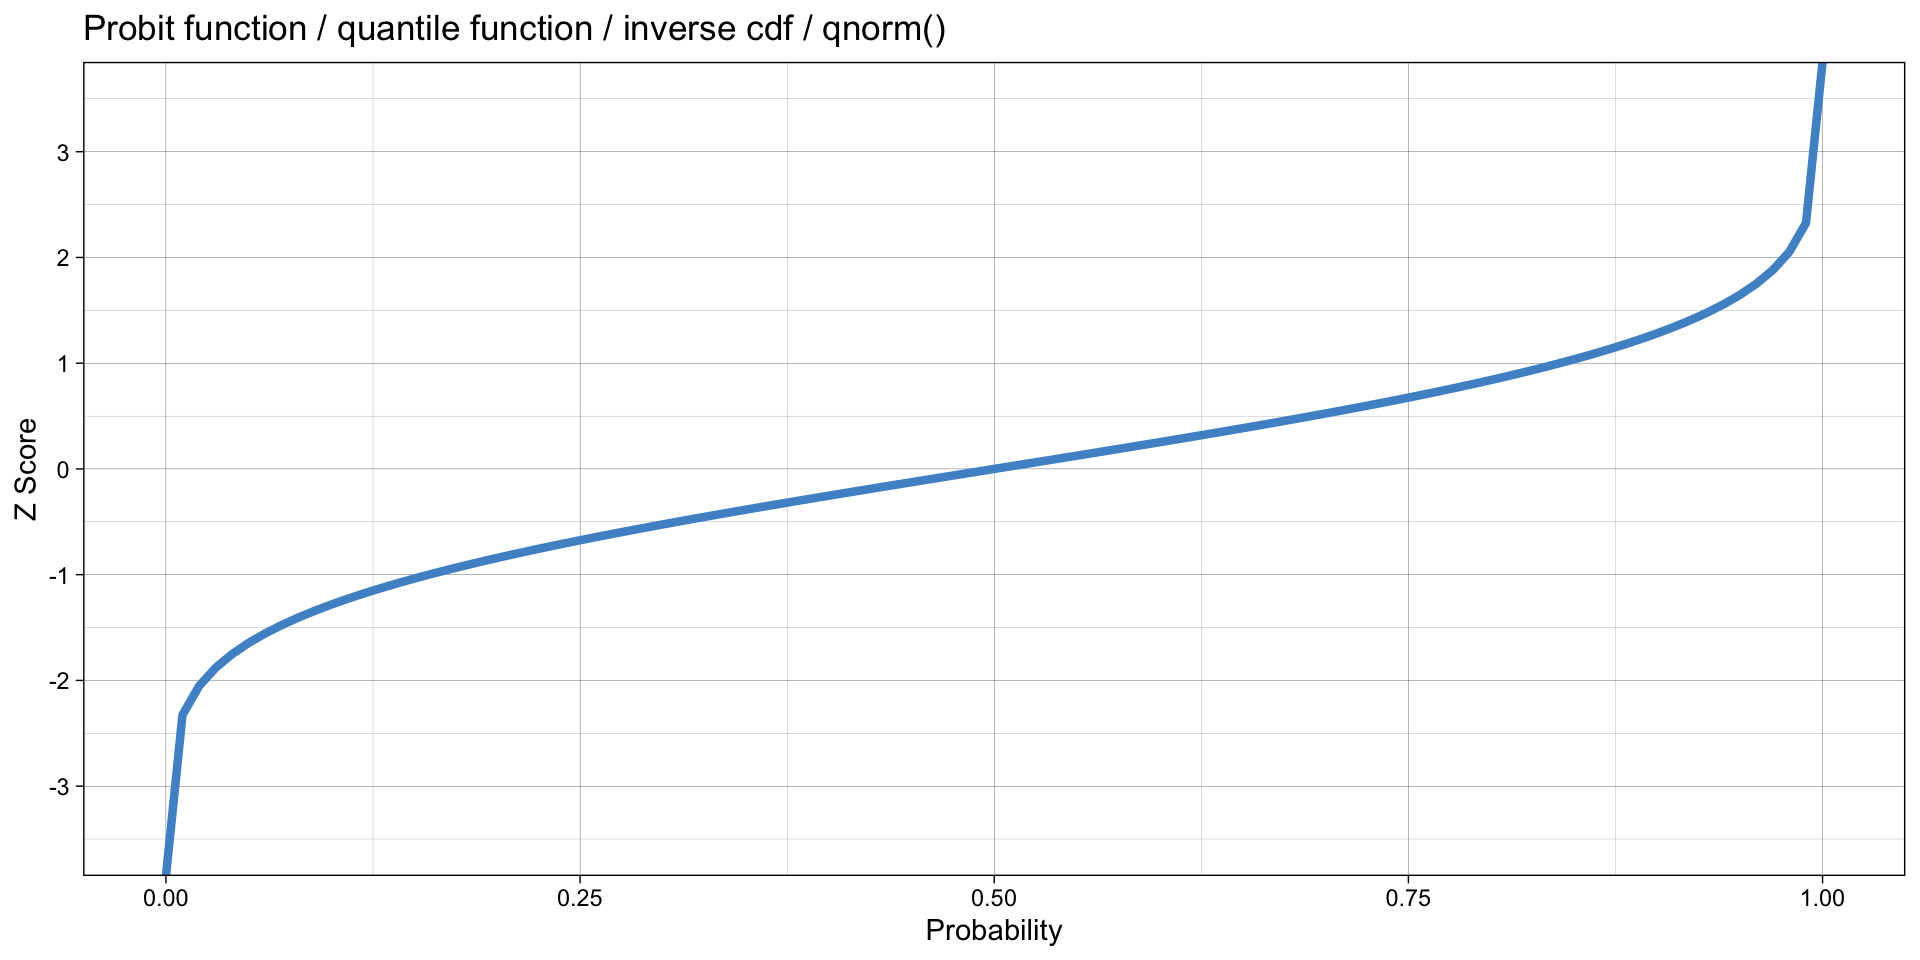
Probit function / quantile function / inverse cdf: qnorm()
Using Signal Detection to Analyze Data in R
We will look at an example using data from a recognition memory test.
Subjects first learn words (study phase).
In the test phase, they are presented with words that were on the list, and with new words.
Subjects have to classify words into
old(yes, this was on the list)new(no, this wasn’t on the list)
These kind of data are usually analyzed using a Signal Detection model.